REDCap Database Design & Management
What is REDCap?
REDCap (Research Electronic Data Capture) is a secure, HIPAA-compliant platform used globally to support clinical and longitudinal research. It enables structured data capture, workflow automation, survey logic, audit trails, and multi-site collaboration within regulated environments.
For many teams, REDCap functions as a form builder or survey tool.
I work with it as a full-fledged product platform.
How I Approach Database Design
I approach every data platform as a product design problem, not a configuration exercise. I start with discovery, speaking directly with coordinators, analysts, clinicians, and researchers to understand real workflows, decision points, and sources of friction.
From there, I design clear, intuitive data experiences that balance usability, regulatory requirements, and long-term scalability. My focus is on reducing cognitive load, preventing downstream errors, and building systems that hold up across multiple sites, teams, and years of follow-up.
Much of my work has involved designing within highly constrained environments, which has sharpened my ability to create strong UX, resilient architectures, and thoughtful abstractions even when tools are limited. That experience now informs how I evaluate platforms, identify their limits, and design better solutions.
The goal is always the same: build tools that feel effortless for users and dependable behind the scenes, so teams can focus on research, not systems.
Case Study: Multi-Site Cohort Database
SEARCH CVD | SEARCH for Diabetes in Youth
Problem
Multi-site research teams across three states needed a single, secure, and scalable digital platform to support longitudinal clinical, survey, and biospecimen data collection. Existing tools and processes were fragmented, increasing operational burden, data quality risk, and variability across sites, all within a highly regulated research environment.
My Role
Product lead for a 0→1 digital platform initiative, owning product discovery, requirements definition, UX design, and delivery coordination across clinical, laboratory, data, and regulatory stakeholders.
What I Built
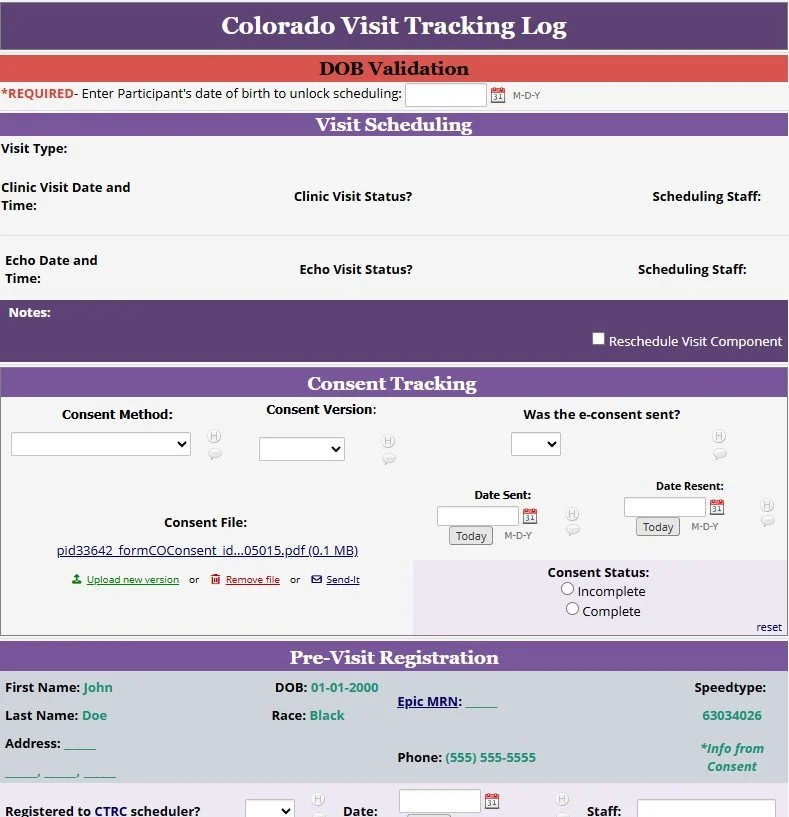
A centralized, audit-ready research platform designed to reflect real-world clinical and laboratory workflows, including:
70+ configurable data collection instruments mapped to clinical, survey, and biospecimen workflows
Longitudinal event architecture with automated timing windows to support protocol-driven follow-up
Integrated contact logs, alerts, and quality assurance workflows to reduce manual tracking
Custom lab value tables and structured data displays to support clinical interpretation and review
Role-based, cross-site permission layers aligned with IRB, HIPAA, and GCP requirements
Quality control, discrepancy detection, and reporting workflows to support monitoring and audits
Import frameworks to migrate and normalize legacy Microsoft Access data without data loss
Regulatory & Quality Considerations
The platform was designed and delivered within a strict regulatory context, incorporating privacy-by-design principles, audit readiness, controlled access, and traceable data workflows to support IRB oversight, GCP compliance, and multi-site governance.
Impact
Reduced data errors by 30%, through standardized workflows and automated quality checks
Decreased coordinator time per participant by 25%, by eliminating redundant manual processes
Enabled automated reporting for PI and leadership teams, improving visibility and decision-making
Improved cross-site consistency, aligning data collection and review practices across three states
Code Snippet
<table style="border-collapse: collapse; width: 99.9489%; height: 34px;" border="1"><colgroup><col style="width: 26.6809%;"><col style="width: 9.79244%;"><col style="width: 22.2822%;"><col style="width: 41.1558%;"></colgroup>
<tbody>
<tr style="height: 24px;">
<td style="text-align: center; background-color: #d4c6e6; border-style: hidden;"><span style="font-family: georgia, palatino; font-weight: normal;">BMI (<em>optional)</em></span></td>
<td style="text-align: center; background-color: #d4c6e6; border-style: hidden;" colspan="2"><span style="font-family: georgia, palatino; font-weight: normal;">Calculated BMI</span></td>
<td style="text-align: center; background-color: #f8cac6; border-style: hidden;"><span style="font-family: georgia, palatino; font-weight: normal;"><em>BMI flag<span style="font-size: 8pt;"> </span></em><span style="font-size: 8pt;"><em>(overweight </em>≥<em>25-29.9, obese </em>≥30)</span></span></td>
</tr>
<tr style="height: 10px;">
<td style="text-align: center; border-style: hidden;">
<div style="display: inline-flex; align-items: center;"><span style="display: inline-block;">{cvd_mra_bmi_1}</span> kg/m<sup>2</sup></div>
</td>
<td style="background-color: #afaab5; border-style: hidden; text-align: left;">BMI (US)</td>
<td style="background-color: #afaab5; border-style: hidden; text-align: left;">{cvd_mra_ibmi_calc}</td>
<td style="text-align: center; border-style: hidden;">
<p>{cvd_mra_bmiflag}{cvd_mra_bmiflag_3}</p>
</td>
</tr>
</tbody>
</table>
What I Build
End-to-end research data platforms for multi-year, multi-site cohort studies, designed for scale, governance, and long-term maintainability
Complex data capture and validation logic, including branching rules, calculated fields, and cross-form dependencies that reflect real clinical and laboratory workflows
Automated operational workflows for recruitment, scheduling, follow-up, and status tracking to reduce manual coordination and error
Secure APIs and system integrations to move data reliably between REDCap and downstream analytics or operational systems
Interactive dashboards and reporting layers tailored to different roles, including coordinators, investigators, and analysts
UX-optimized interfaces in constrained environments, improving clarity, usability, and adoption within tools that are not UX-native
Robust data quality frameworks, including multi-step validation rules, discrepancy detection, and consistency checks across longitudinal records
Longitudinal event architectures spanning clinic visits, surveys, and biospecimen tracking across time and sites
Custom HTML and CSS enhancements to improve data entry accuracy, interpretation, and user confidence
Role-based, multi-site permission models aligned with IRB, HIPAA, and GCP requirements
Comprehensive data documentation and governance artifacts, including data dictionaries, SOPs, and change-control models
Migration and normalization frameworks to safely bring legacy Access or Excel datasets into modern, governed REDCap environments


Logo Design
Data Management & Quality Engineering
I oversee the entire lifecycle of research data across complex, multi-site environments by modeling structures, enforcing data quality, and ensuring every user has reliable, analysis-ready information.
Beyond form-building, I design scalable data architectures, maintain production systems, and run validation pipelines aligned with modern data engineering standards.
What This Looks Like in Practice
Data Model Architecture
Designing relational data structures across longitudinal events, linked instruments, and multi-system workflows. Ensures consistency, scalability, and clean downstream analytics.
QA/QC Pipelines
Writing SAS programs to automate discrepancy checks, validate derived variables, detect drift or inconsistencies, and generate automated exception reports.
System Maintenance & Governance
Performing routine database reviews, resolving errors, maintaining dictionaries, and ensuring compliance with regulatory standards.
Integration & Interoperability
Supporting API connections, synthetic data imports, and secure export pipelines for analysts and collaborators.
Documentation & Reproducibility
Creating data dictionaries, SOPs, codebooks, and reproducible scripts for transparent, scalable use across teams.
Data Visualization & Operational Tracking
What This Includes
Operational Dashboards
Building dashboards (in REDCap, R, SAS, Notion, or custom formats) that track recruitment, retention, biospecimen workflows, protocol adherence, and progress against milestones.
(Translates to: KPI dashboards, BI tools, performance tracking.)
Real-Time Monitoring
Creating systems that automatically flag delays, missing data, follow-up requirements, or protocol deviations—helping teams stay ahead of problems instead of reacting to them.
(Translates to: alerting systems, pipeline monitoring, proactive risk management.)
Analytics for Decision-Making
Using SAS, R, SQL, and visualization techniques to translate raw data into reports that inform planning, resource allocation, and strategic adjustments.
(Translates to: product analytics, operational analytics, performance insights.)
Progress Tracking & Milestone Forecasting
Developing tools to track multi-site timelines, estimate completion trajectories, and ensure deliverables remain on schedule.
(Translates to: roadmap tracking, delivery management, technical PM skills.)
Stakeholder Communication
Distilling complex datasets into clean, intuitive visuals that support PI teams, coordinators, leadership groups, and external partners.
(Translates to: executive reporting, cross-functional communication, data storytelling.)